
See how many people have viewed or interacted with a specific page or blog post and its attachments.

What can the Content Report do?
Select “Content Report” in the page heading to display many page-related metrics and display them in a graph.
-
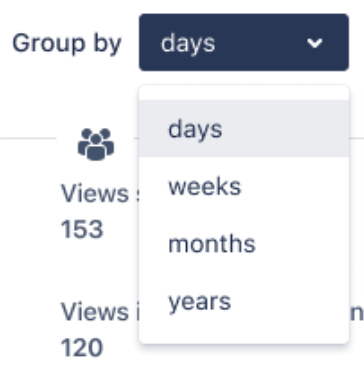
Group the metrics in the graph by days (default), weeks, months, or years.
-
Specify which metrics to display in the graph.
-
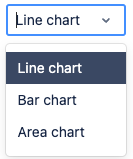
Display the metrics as a line (default), bar or area chart.
-
Use the breadcrumb to navigate between Content, Space and Global reports (depending on your access permission).
-
In the tab "Viewers," you can see who viewed the page and how many times (depending on privacy settings).
-
In the tab “Attachments,” see the number of attachments and attachment views.
-
Export the desired metrics as a CSV file.
Please note. We will use the term "page" to refer to both pages and blog posts, as all options apply equally to both.
-
It may take up to 1 minute for recent views to appear in the report.
How to access the Content Report
-
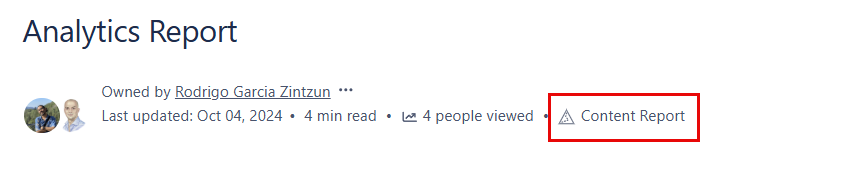
Navigate to your desired page or blog post.
-
Tap on the "Content Report" icon above the page content.
-
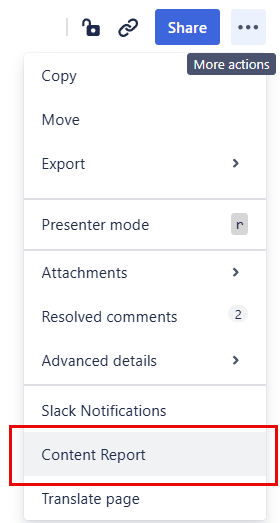
Alternatively, select "More actions" and select "Content Report.”
-
Alternatively, you can tap on any page or blog post listed in any other Viewtracker report to access its Content Report.
In Short
The following preview, which opens first, provides a quick insight into the content's usage over the past 30 days.
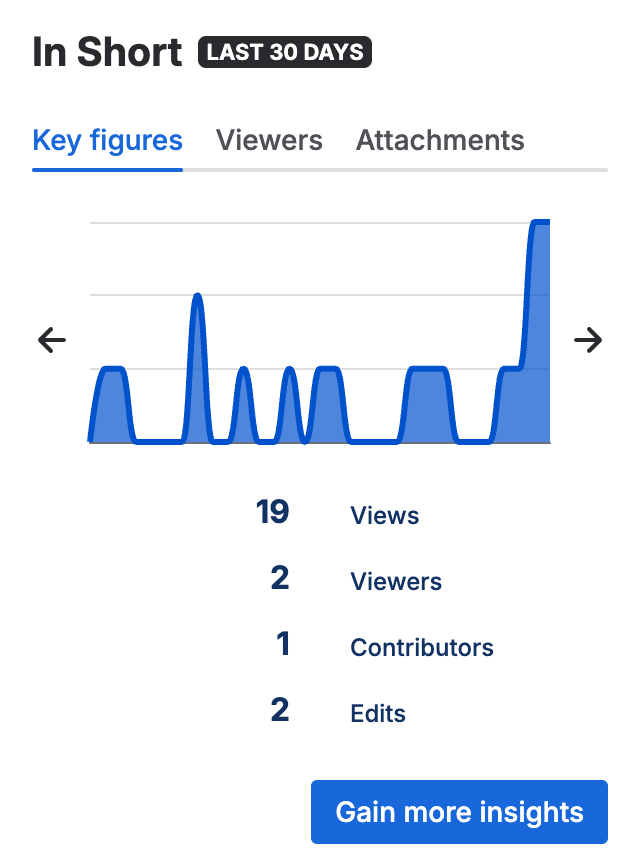
Tab “Key figures” (Default)
Chart
The rotating chart automatically displays changes in metrics such as views, viewers, content edits, contributors, and comments over the past 30 days.
-
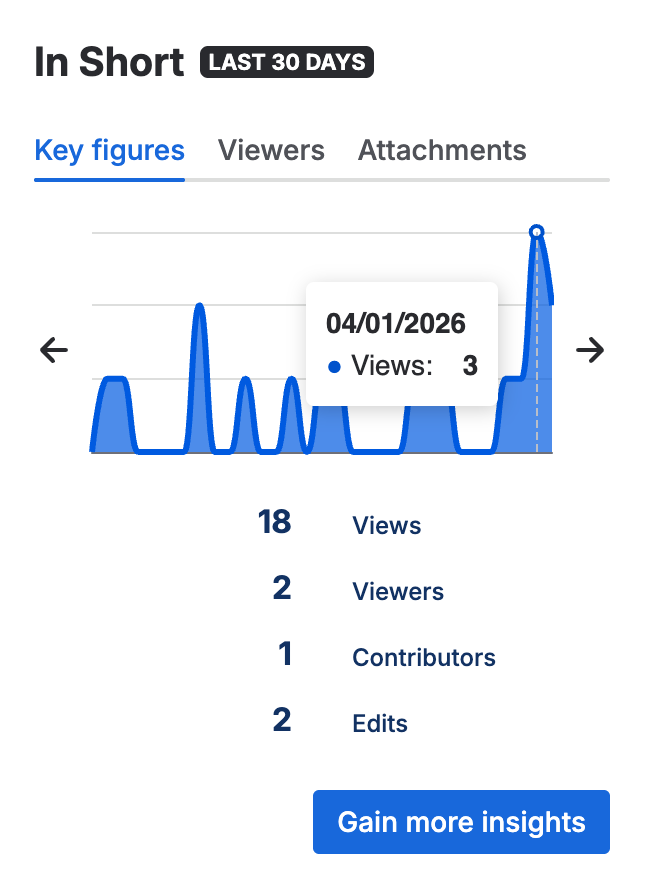
Use the left and right arrows to navigate through the chart at your own pace.
-
Hover your mouse over the chart to pause the rotation and view detailed information for each day shown.
Key figures
This list shows the total of the most important metrics for the last 30 days.
Tap the "Gain more insights" button to open the Content Report, which includes extended date ranges, additional metrics, usage data, and an export option.
Tab “Viewers”
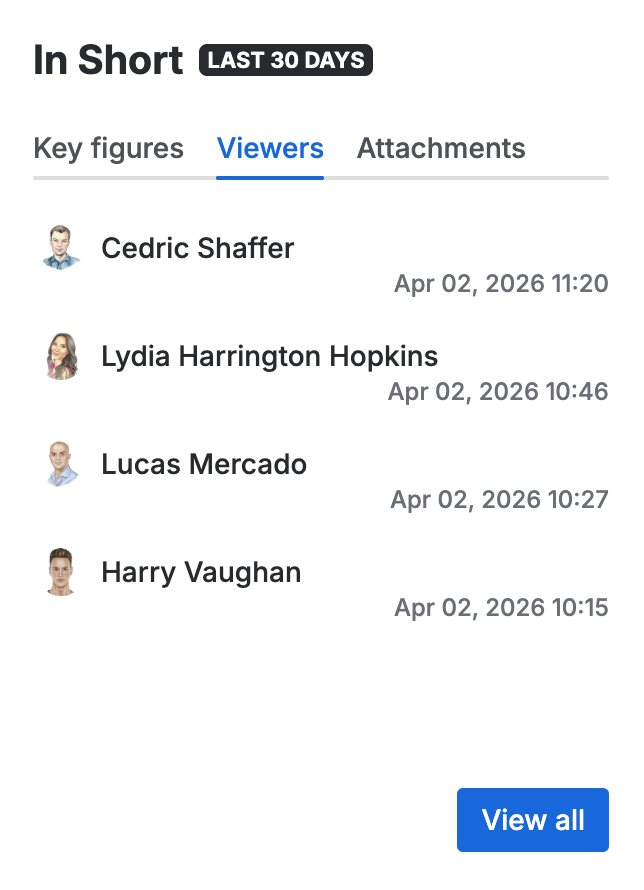
This tab presents the top five users who visited the content, listing each user's name along with the date and time of their most recent visit in the last 30 days.
Note: This tab is available only if the Viewtracker data privacy settings permit tracking and displaying viewer-related information to you.
Tap the “View all” button to open the Content Report’s viewers tab, which displays all users who visited the content, allows user search, provides more information, and supports extended date ranges.
Tab “Attachments”
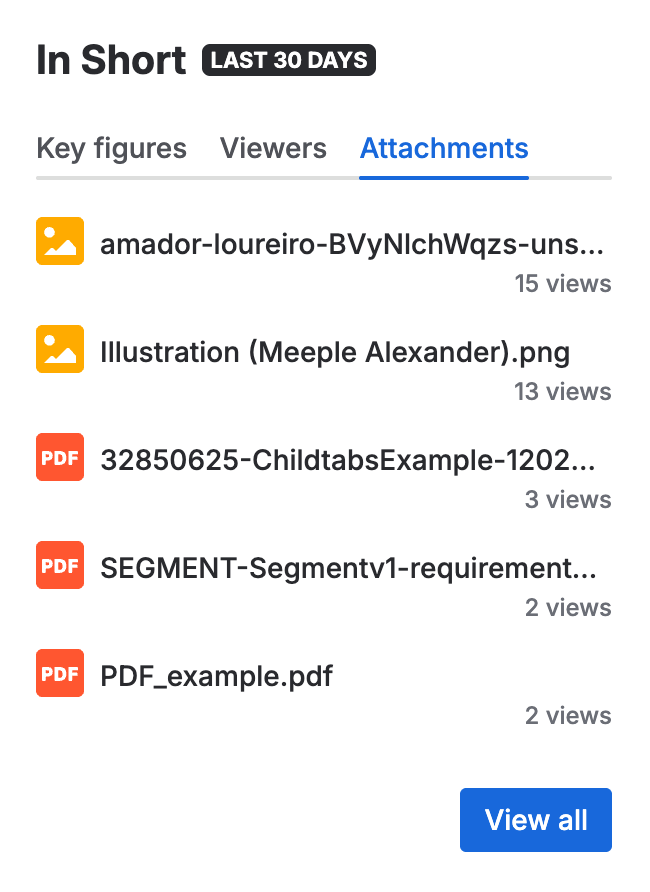
This section lists the five most viewed or downloaded page attachments and their counts for the last 30 days.
Click the “View all” button to access the attachments tab of the Content Report. This will display all viewed attachments along with their viewers, provide more detailed information, and allow you to extend the date ranges.
Content Report
With Atlassian’s new Forge framework for Confluence Cloud, the Content Report now opens over the Space Report rather than directly over the page or blog post. This enables quick access to view Content Reports for different content in the space, without needing to open the corresponding page or blog post first. In addition, all other reports at the space level are accessible, allowing you to quickly analyze usage for the entire space or its parts.
Tab “Content” (Default)
The first tab, "Content," will be selected by default and will display a graph of views and edits to this page over the last 30 days (this value can be changed). Below, you can find a description of its elements.
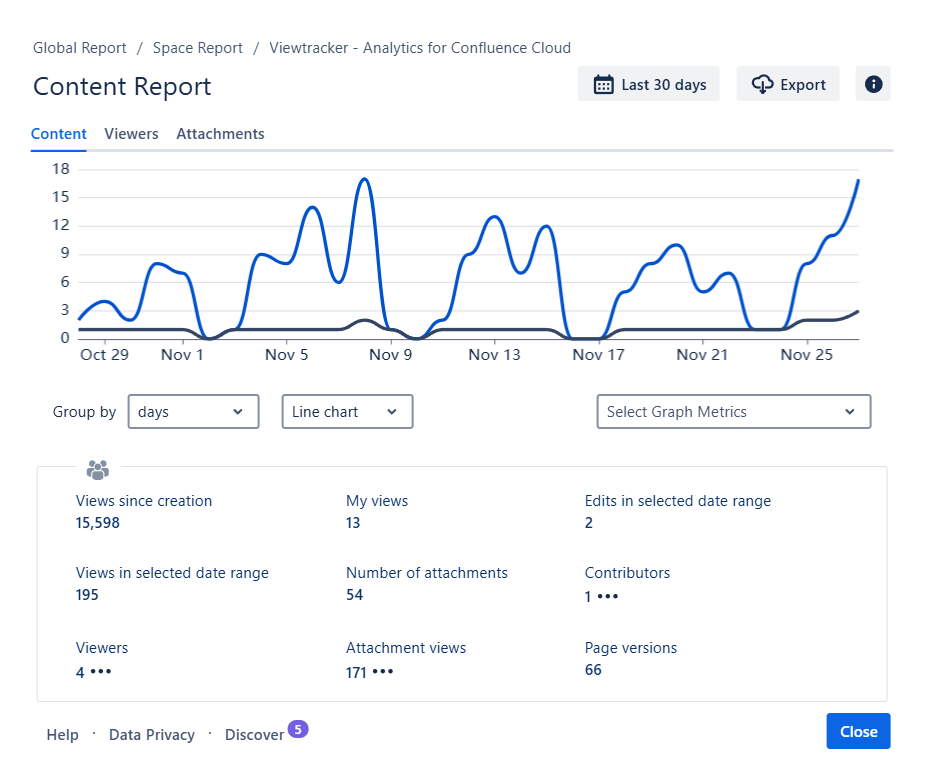
Elements of the Content Table
The table below the graph contains the following metrics:
-
Views since creation: The total number of views since the page was created.
-
Views in selected date range: The number of views in the selected date range.
-
Please note: If the page was created recently, the numbers of "Views since creation" and "Views in selected date range" will be the same.
-
-
Viewers: The number of individual users who have visited this page.
-
Clicking the three dots opens the “Viewers” tab and lists them (see below).
-
-
My views: The number of times you have viewed this page yourself.
-
Number of attachments: The number of files attached to this page.
-
Attachment views: Number of times the attachments were viewed or downloaded.
-
Clicking the three dots opens the “Attachments” tab and reveals more details (see below).
-
-
Edits in selected date range: How many times the page was edited in this period.
-
Contributors: Number of Confluence users contributing to this page’s content.
-
Page versions: The number of times a new version of this page was published.
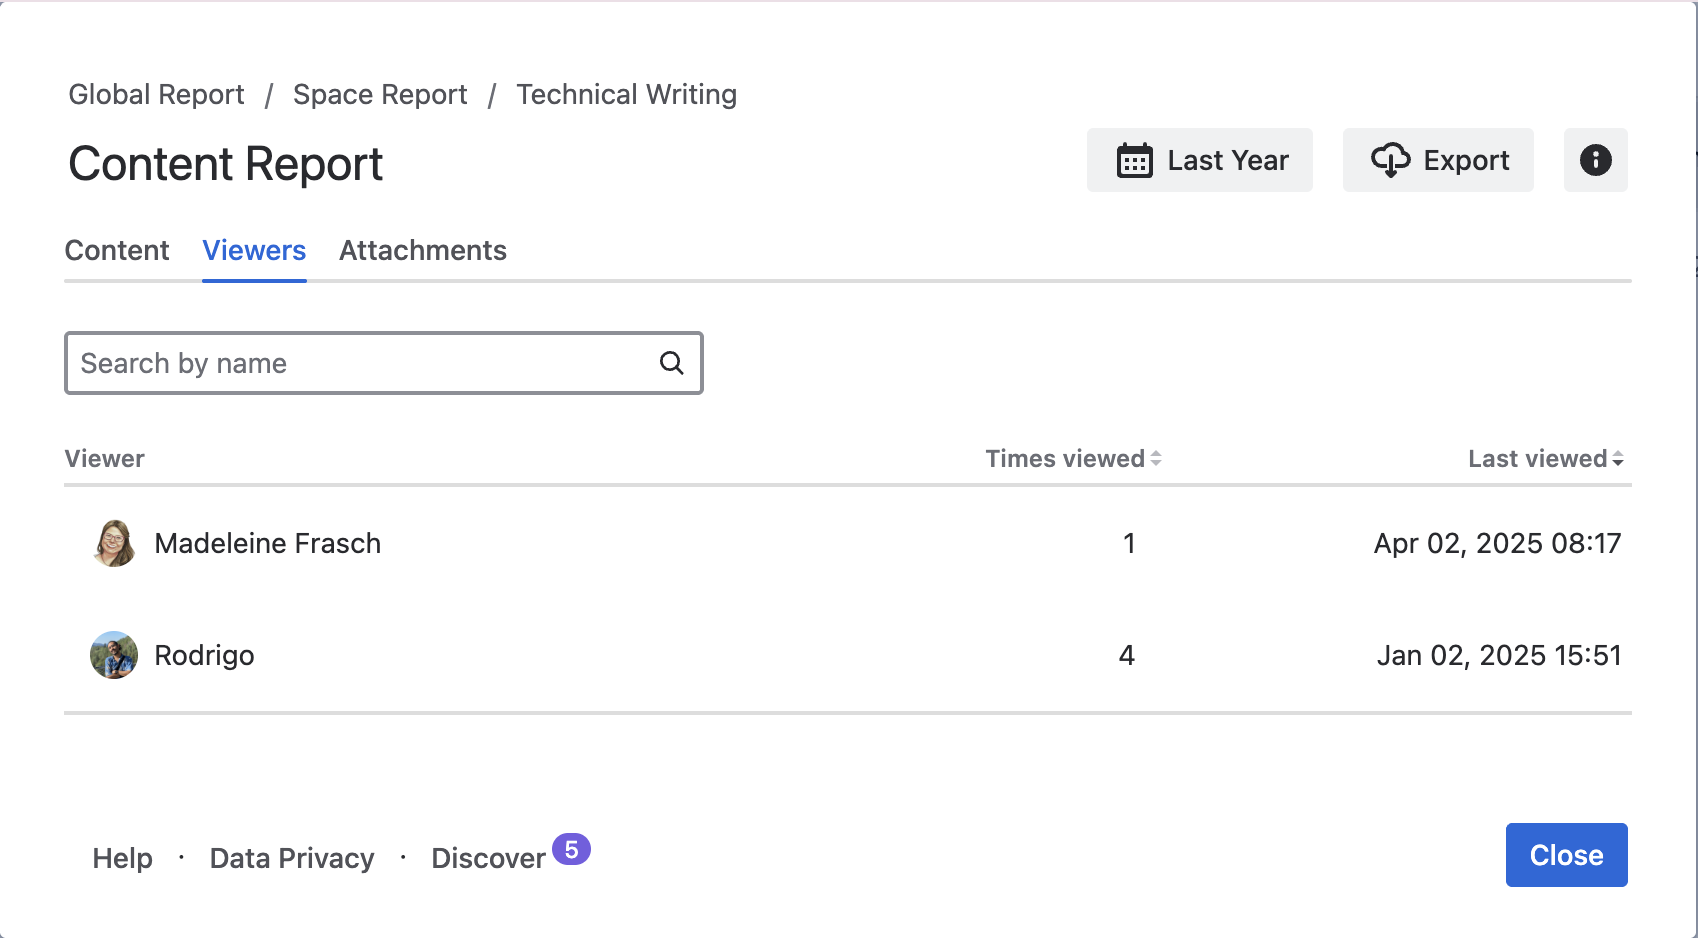
Tab “Viewers”
Depending on your Data Privacy setting, the Content Report will include a "Viewers" tab that shows which users viewed this content, when, and how many times within the selected date range.
-
The table is sorted by “Last viewed” and displays the number of times each user visited the page and the date of their last visit.
-
Through the search field, you can filter the list by name.
Special Viewers
-
If your page or blog post is open to the public, you may also see the number of page views by “Anonymous” (external visitors without a Confluence log-in).
-
If you see "Protected Confluence Users" in the "Viewers" tab, the privacy setting was once set to Extended Privacy Mode.
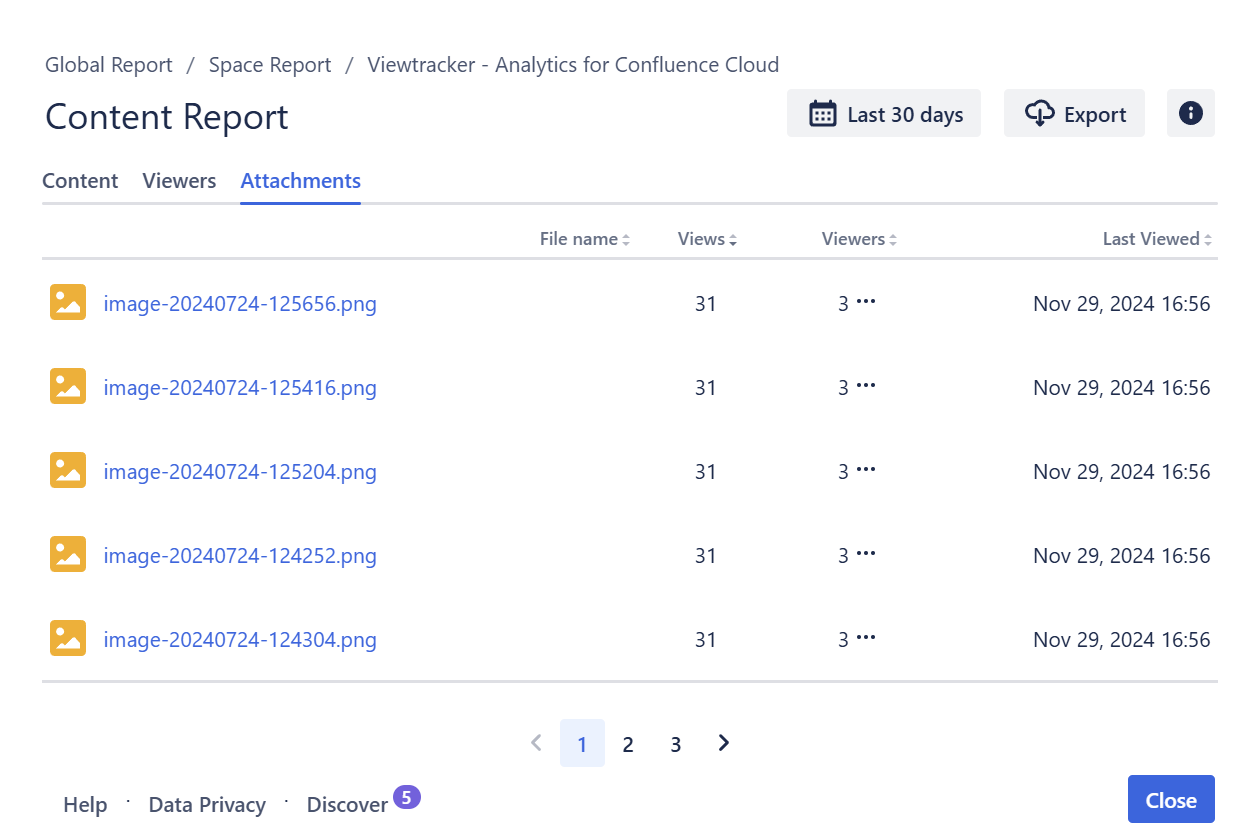
Tab “Attachments”
This report shows you the attachments on the page. The list depends on which attachment types the Confluence administrator has chosen to track in the global attachment settings.
-
The column “File Name” lists the attachment's name and file extension.
-
The column “Views” lists the views this attachment has generated in the selected date range.
-
The column “Viewers” lists the number of viewers who have viewed or downloaded the attachment.
-
The three dots next to that number are displayed only if data privacy allows it.
-
Clicking these dots opens a dialog listing this attachment’s viewers.
-
-
The column “Last viewed” displays the timestamp of the last time an attachment was viewed or downloaded.
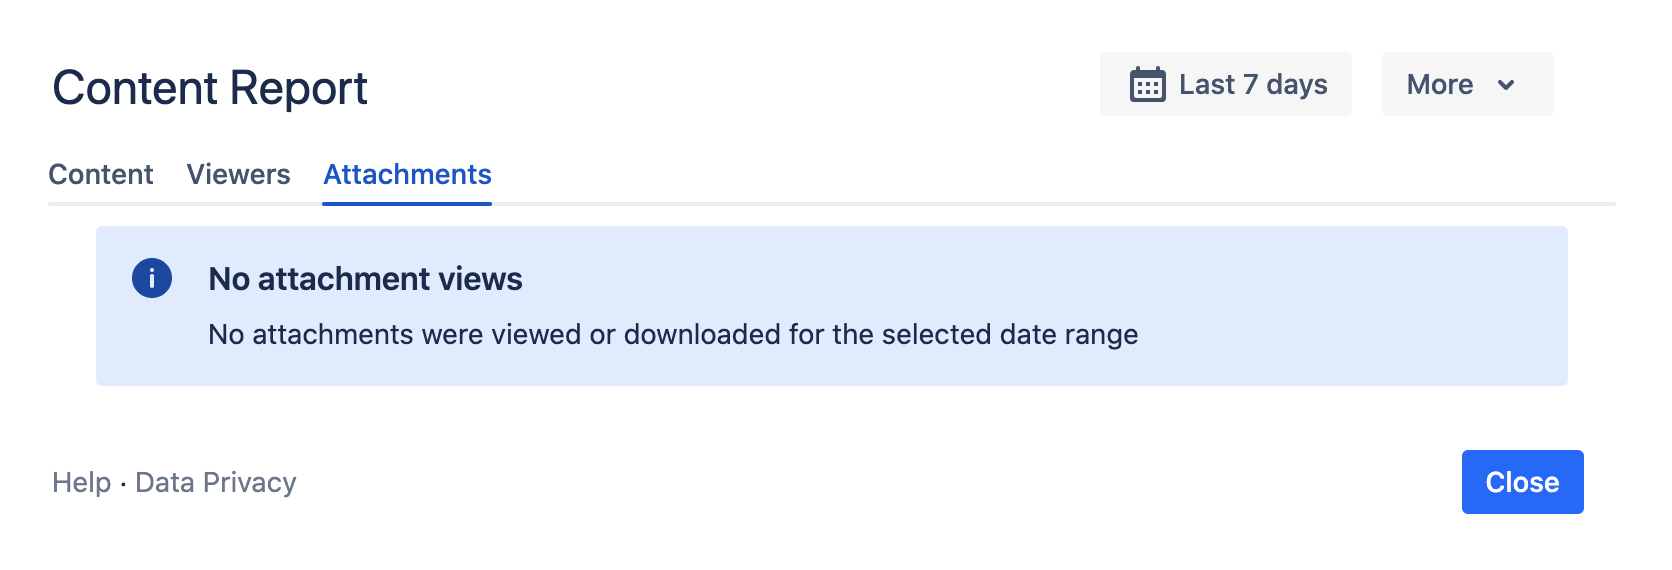
If the page contains no attachments, this info panel is displayed:
Changing the date range and graph type
-
As a default, the data from the last 30 days are displayed. You can change that by clicking into the date field and selecting a different date range. All metrics will adapt automatically.
-
You can group the metrics in the graph by using “Group by” days (default), weeks, months, or years.
-
You can display the numbers as a line chart (default), bar chart, or area chart.
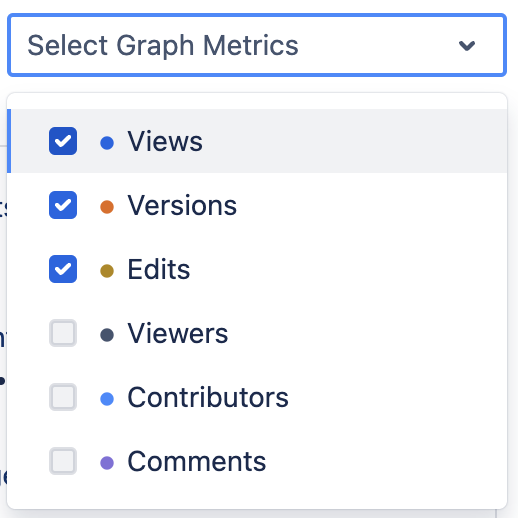
Choosing which metrics to display in the graph
Below the graph, there is a drop-down menu listing the available metrics. By default, “Views”, “Versions” and “Edits” are selected.
Versions are marked by a red vertical line on a specific date. A page may have various versions published on the same date. Versions are displayed as a trend line.
Select the metrics you want to appear in the graph, and the graph will adapt automatically. Viewtracker saves the metric selection; whenever you access the report in the future, the selected metrics will be displayed in the graph.
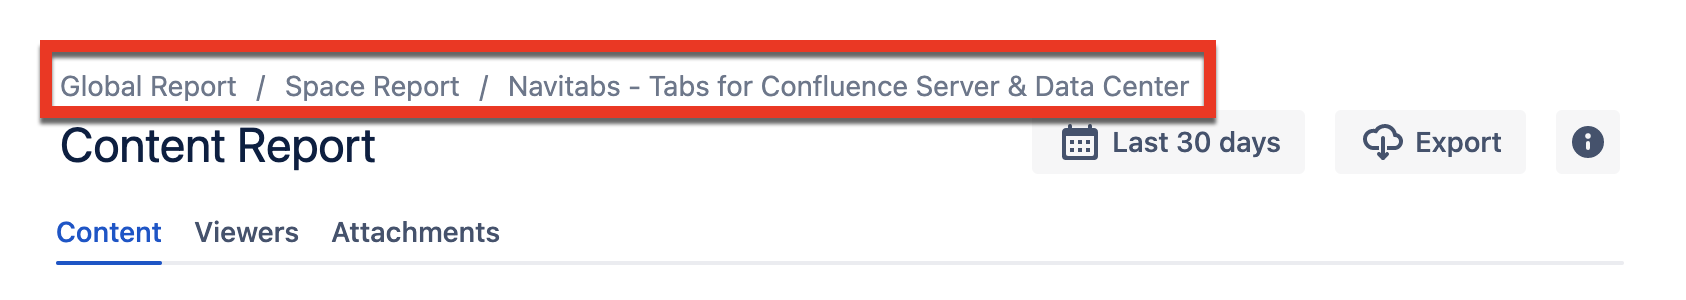
Breadcrumb
Use the breadcrumb in the header to access the Global Report or Space Report (depending on your access permission). The Global or Space Report will open as a new tab. The date range and metric grouping selected in one report will automatically be adapted to the other reports.
The entry on the right side of the breadcrumb is the page/blog post name. Tapping the name will open the page in a new tab so you can access its content.
As mentioned, the Content Report opens over the Space Report. Close the current Content Report to access the Space Report and its features.
Exporting data
You can export the data in the Content Report at any time. See Export Viewtracker Data for details.
Restricting access to the Content Report
By default, any user with a Confluence login can access the Content Report and Space Report (i.e., anonymous users never have access to Viewtracker reports).
A Confluence administrator or a space administrator can restrict access to the Content Reports. Read here for the complete documentation.
For information on the content of a specific space, refer to the Space Report.